How to Build Explainable Machine Learning models?
A key aspect of intelligence is to not only make predictions, but reason about the uncertainty in these predictions, and to consider this uncertainty when making decisions.
In designing customer facing Machine Learning systems, a key challenge we face is ensuring that our predictions are not only accurate but also interpretable and actionable. It's possible with open source libraries to gather insights that provide insights into the working of a machine learning model, allowing stakeholders to understand why a particular prediction was made that way.
In this post we look at one possible solution using the open source SHAP library
One challenge we face when designing machine learning systems is that of accuracy. Since our model does not have full visibility into all aspects of process behavior (that is being modeled by the machine learning algorithm), we dont have perfect information. Its worth differentiating between "epistemic" uncertainty due to lack of right behavior data (as we have partial observability over user behavior) and "aleatoric" uncertainty, which is irreducible and stems, e.g., from noisy observations and outcomes. i.e we recognize the presence of both epistemic (model-related) and aleatoric (data-related) uncertainty in making predictions.
In interpretability, our primary objective is to understand model's decision-making process without unnecessary complexity. But the model is not perfect and may make incorrect predictions. For example, in a binary classification model, we may observe false positives and false negatives. Modern algorithms are probabilistic in nature: model outputs are predicted probabilities that are associated with a class label and indicate the model's confidence in its predictions.
An explainability solution therefore has following goals:
- Building Trust and Transparency: Clearly articulating the factors influencing the model's decisions helps stakeholders and end-users develop confidence in its outputs. Providing intuitive explanations ensures that users understand why a particular decision was made.
- Enabling Trust Calibration: Mistakes are inevitable in any predictive system. We want to educate and empower users to adjust their level of trust in the model accordingly (much like a weather app). This supports informed decision-making and prevents blind reliance on predictions.
- Encouraging Contextual Judgment: Rather than promoting a fully automated approach, we want end-users to critically evaluate model outputs within their specific context. Encouraging human oversight ensures that the model serves as an assistive tool rather than an unquestioned authority.
Overall, a successful outcome is that a majority of users report the explanations improved their understanding of the prediction and their willingness to take appropriate action, without blindly trusting the AI.
SHAP (SHapley Additive exPlanations)
SHAP (SHapley Additive exPlanations), a popular library that provides model-agnostic explanations using game-theoretic principles. Under the hood SHAP builds model explanations by asking the same question for every prediction and feature: "How does prediction i change when feature j is removed from the model?" When visualized, SHAP tells us how much and in which direction a feature influences a prediction, positive or negative. This helps us see which factors matter most, and why, for any individual prediction.
The goal of SHAP is to explain the prediction of an instance x by computing the contribution of each feature to the prediction. It can provide local explanations for each instance in the dataset. It offers intuitive waterfall charts that break down how each feature contributes to an individual prediction, making it easier to interpret model decisions.
SHAP Library
The Python software package shap, developed by Scott Lundberg et al., provides utilities to calculate and plot SHAP values. For example a bar chart showing grouped SHAP values (for at-risk) using the SHAP scale, the goal is to clearly illustrate the extent and direction of each group's influence on the prediction.
Waterfall chart, SHAP grouped values (for at-risk) converted into probability scale, to intuitively illustrate how each group's contribution impacts the overall at-risk probability predicted by the model.
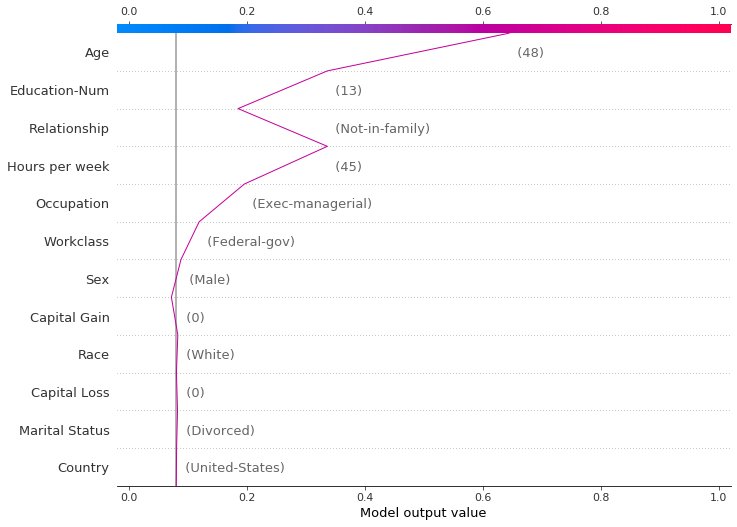
The decision plot's straight vertical line marks the model's base value. The colored line is the prediction. Feature values are printed next to the prediction line for reference. Starting at the bottom of the plot, the prediction line shows how the SHAP values (i.e., the feature effects) accumulate from the base value to arrive at the model's final score at the top of the plot.
User evaluation
- During our evaluations (especially the workshop), we will ensure participants encounter examples of each of the above scenarios. We will then use targeted questions to gauge their reactions. For instance we can ask: "In scenario X, the model was wrong about a certain class label. Did the explanation give you any hint that the prediction might not be reliable, or did it make you too confident?" or "In scenario Y, the model caught something you didn't initially see, did the explanation help you realize that factor?"
- We will measure outcomes like whether users changed their mind after seeing the explanation, whether they decided to act or not act based on the explanation, and whether those decisions were appropriate given the final outcome. We are testing the explanation's ability to foster appropriate trust, neither too little (ignoring a correct alert) nor too much (following a faulty alert without question).
- Success criteria: For each scenario type, we can define desired outcomes. In false positive cases, success is if support staff say they doubted the alert and the explanation confirmed their doubt or at least didn't mislead them into overreacting. In true positive cases, success is if users who initially disagreed end up convinced and those who agreed took helpful action.
- False positive cases, Did the explanation indicate uncertainty, or did it make you overconfident in an incorrect prediction?
- True positive cases, Did the explanation highlight factors you hadn't initially considered?
- Decision/nudge impact, Did the explanation influence your confidence in the model's prediction?
Summary:
- User-friendly explanations of our model's decision-making process that end users can leverage to take action, explanations should add value by improving understanding of the model's decision process, allowing them to calibrate their trust in model predictions, and finally using those explanations to guide actions or interventions.
- The model has only partial observability of the world its operating in, so it can make mistakes. Generated explanations should also serve as a reminder to prevent blind faith in the model, as simple as adding a line that says "Model should be seen as a decision-support tool where human oversight remains essential."
Read more:
- christophm.github.io/interpretable-ml-book/shap.html
- How can we do model calibration and show case the model probabilities as well?