Hello, glad you're here
I'm a Sydney-based data analyst with roots in plant biology and molecular genetics. I turn lab and business data into clear insight , with Power BI, SQL, Python, and a love of tidy process.
Research
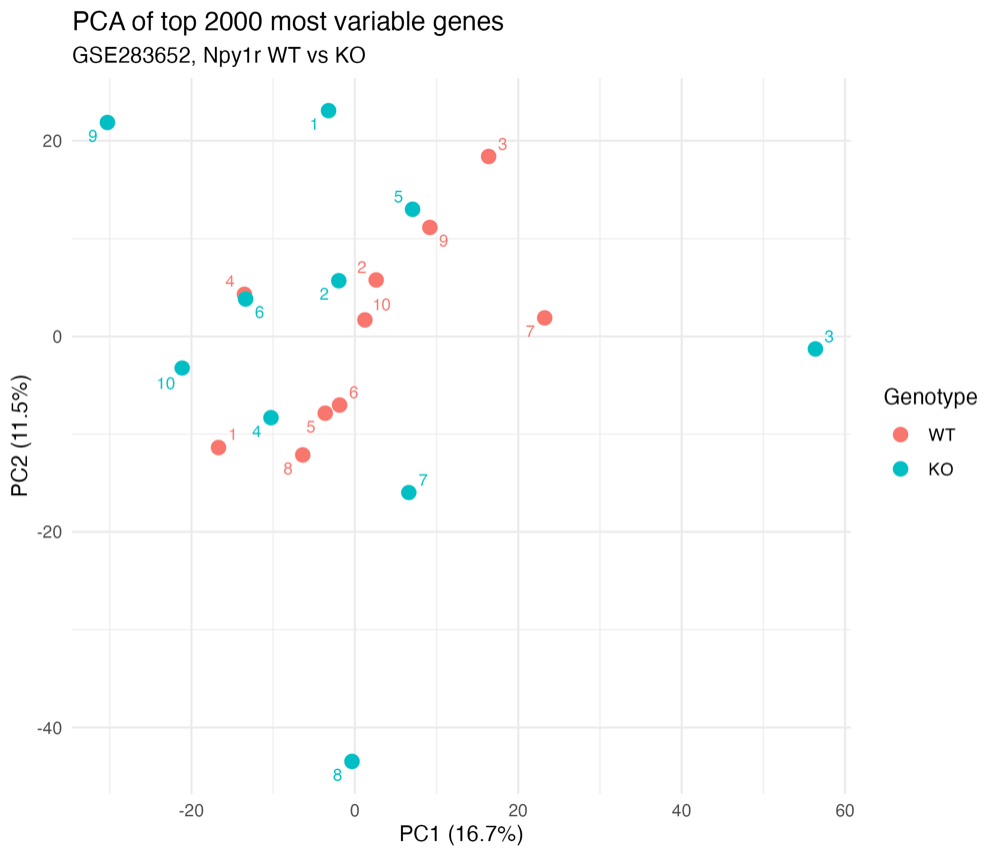
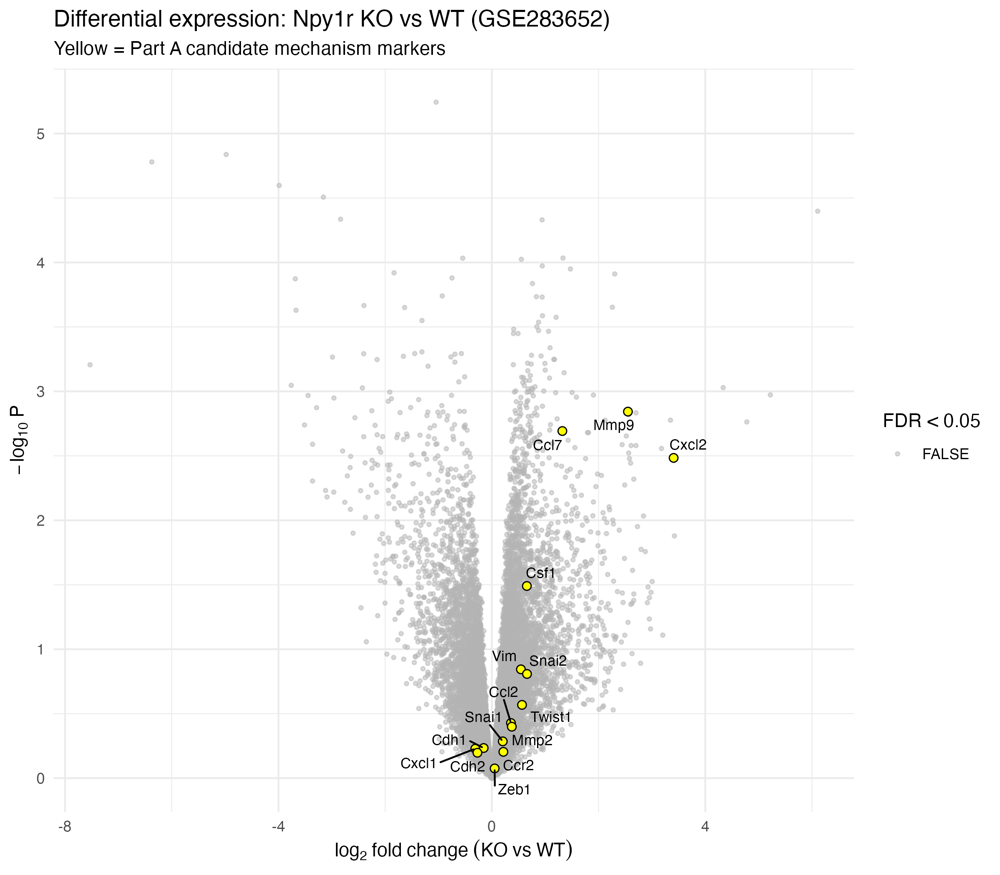
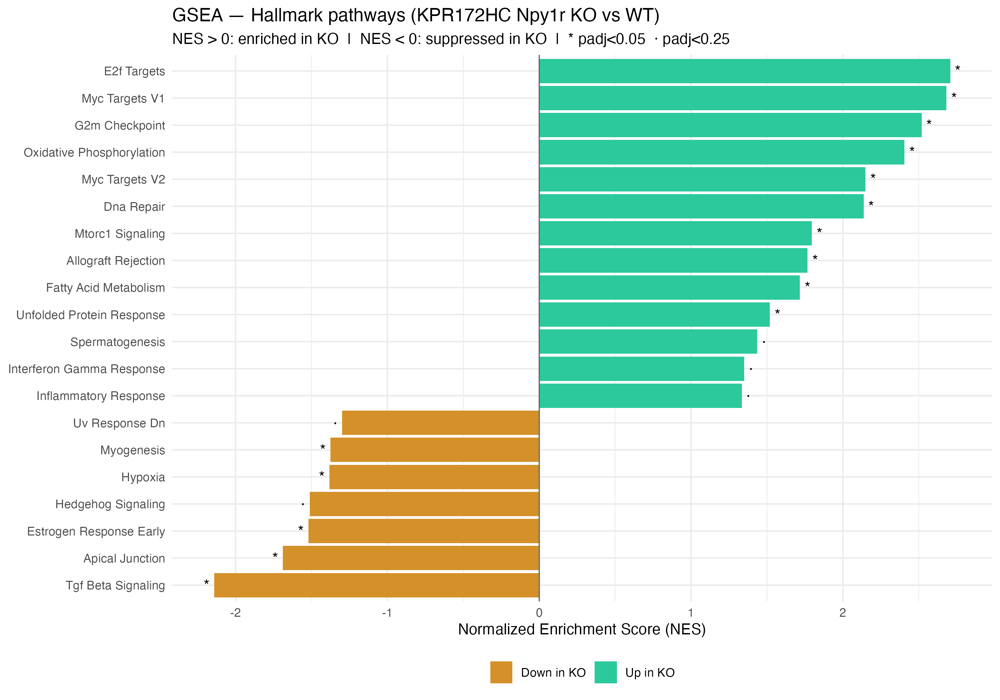
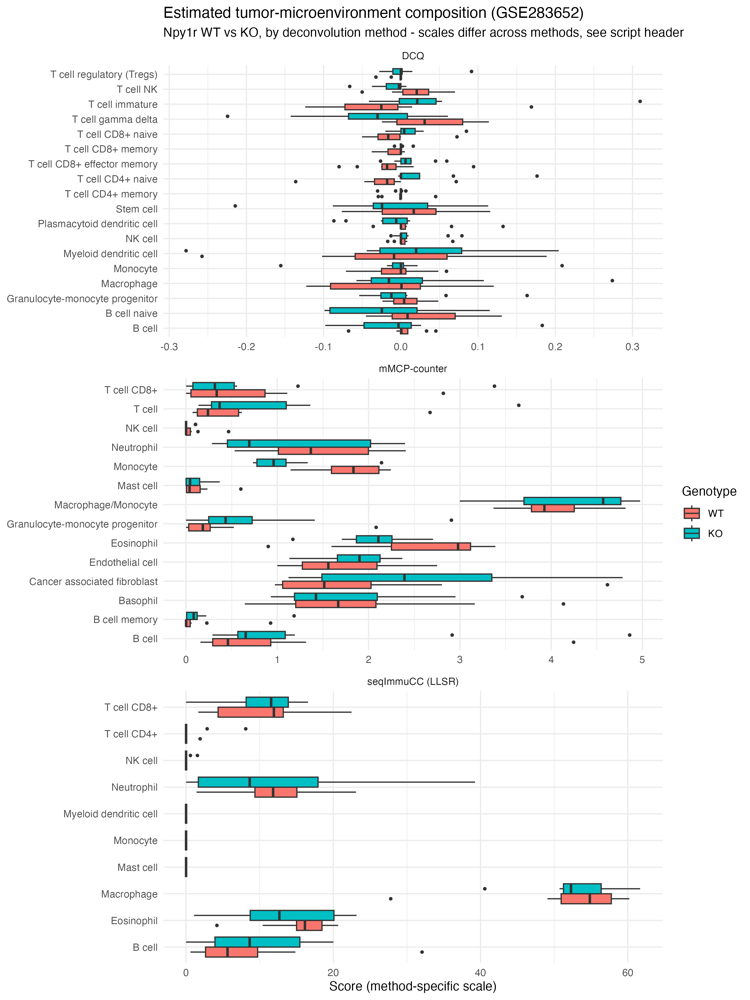
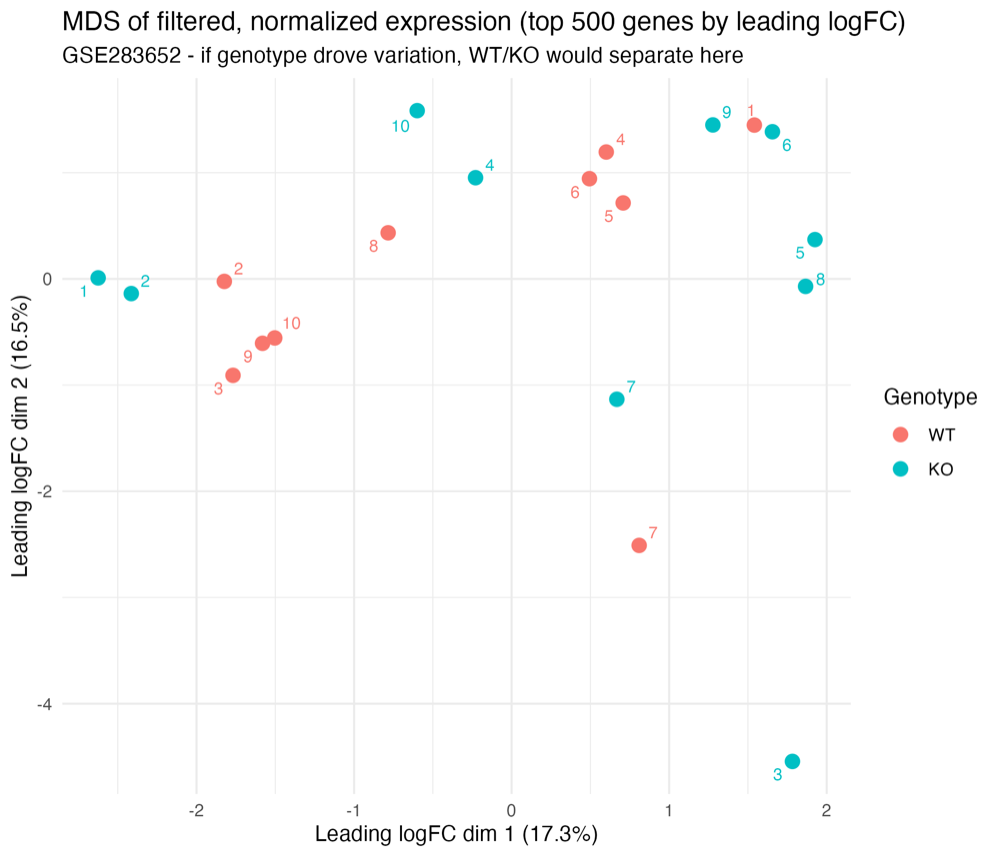
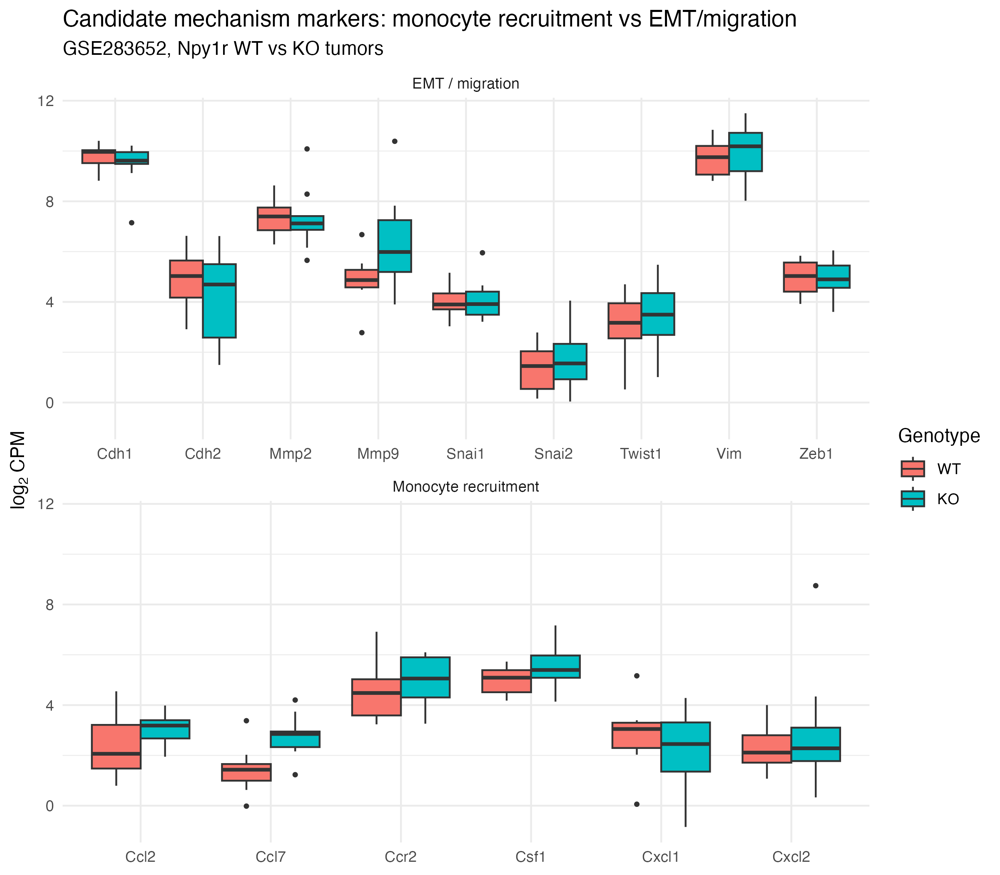
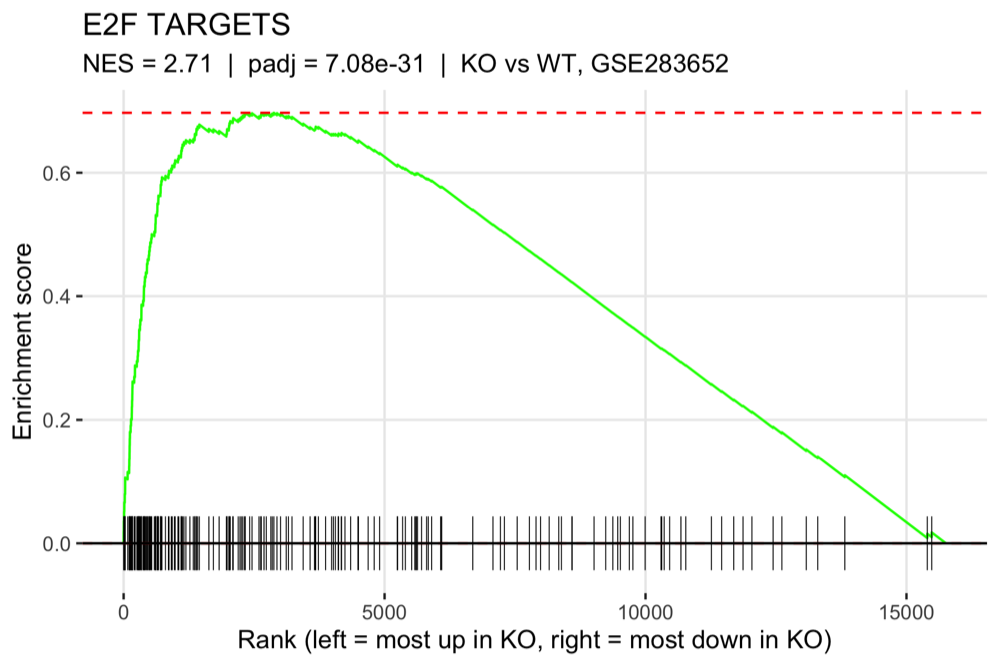
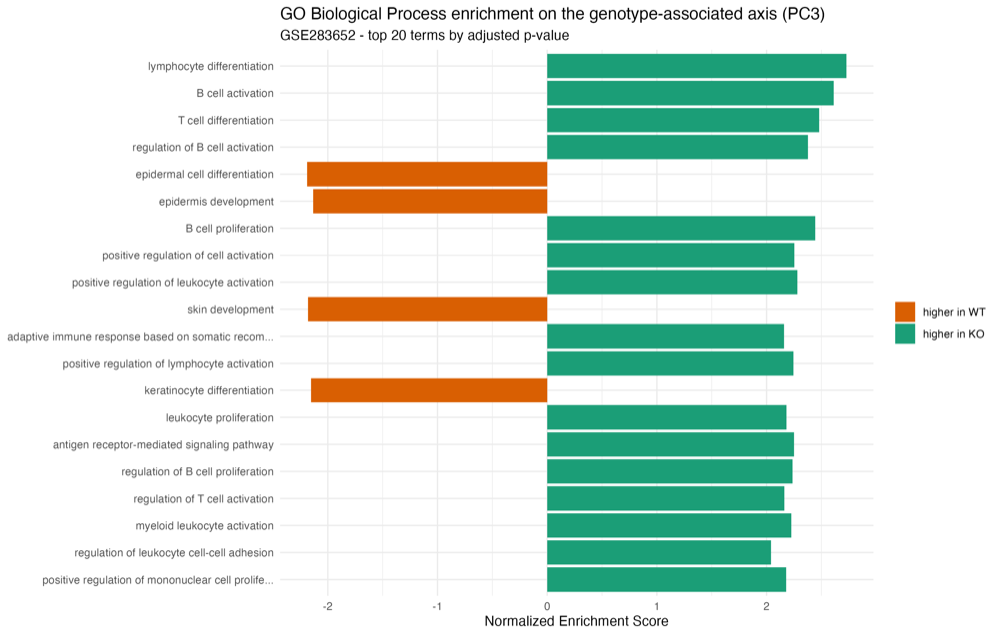
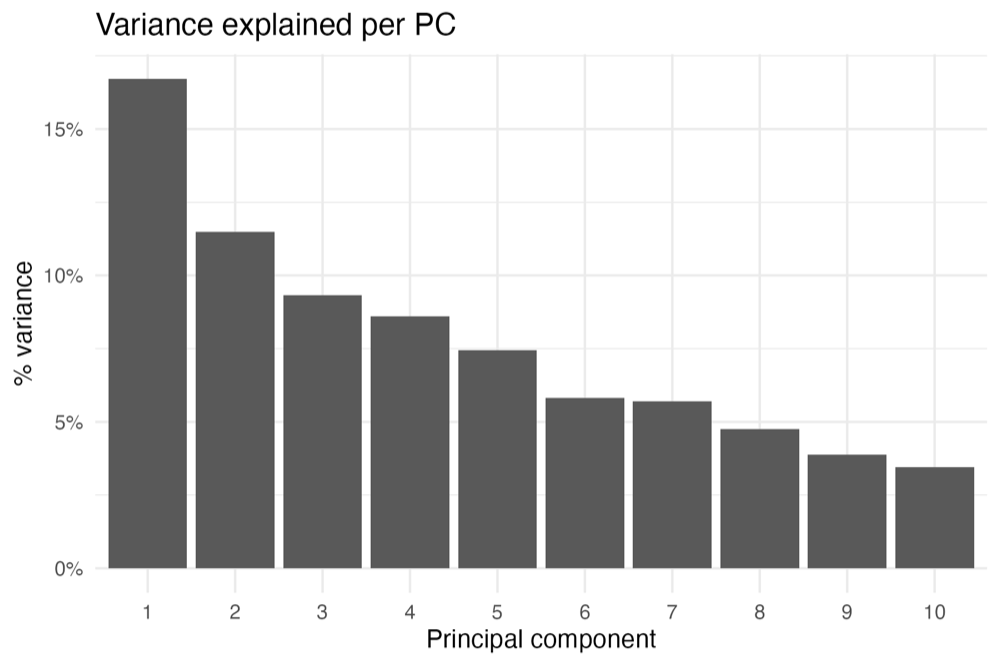
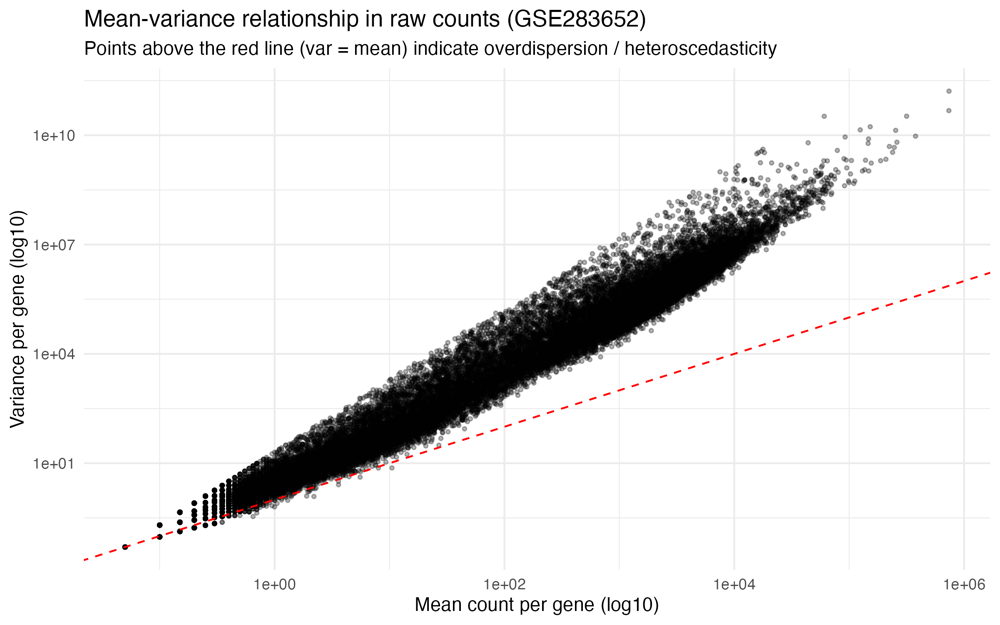
From Master's thesis work on nitrogen use efficiency and geostatistical soil fertility mapping in Central Alberta, to research projects on nutrient responsiveness, spatial interpolation, and mouse PDAC bulk RNA-seq (edgeR QC/TMM, PCA, immune deconvolution), plus transcriptomic workflows for marker discovery, differential expression, and gene-set enrichment. The same quantitative discipline runs through crop field maps and molecular datasets. Browse the orbiting figures for pipeline outputs, then open a domain below for the underlying plots and interpretation.
An illustrative marker-gene dot plot: dot size is the fraction of cells expressing a gene, color is mean expression, and the diagonal pattern shows how a handful of markers separate cell types cleanly.