Comparative Assessment of Soil Fertility Parameters Using Geostatistical Approaches
In this blog post, we begin with the real-world challenge of quantifying spatial heterogeneity in soil fertility across agricultural landscapes. We introduce the research gap by showing that although precision nutrient management depends on accurate soil maps, the choice of spatial interpolation method strongly affects prediction quality. We then highlight the key contribution of this work, a comparative assessment of non-geostatistical and geostatistical approaches for estimating soil fertility parameters. The post showcases the core results and explains why they matter for site-specific nutrient stewardship. Finally, we conclude with broader implications for sampling design, precision agriculture, and sustainable crop management.
Introduction and Background
Spatial heterogeneity in soil properties across the landscape can be conceptualized as a function of interactions between intrinsic factors (for example topography, soil type, and vegetation) and extrinsic factors (management practices and climate). At first glance, the resulting variability can appear random because those interactions are complex and dynamic. Yet significant variation in physical and chemical soil properties exists across a field, and that variability poses a real challenge for farm management from both economic and environmental standpoints.
Precision mapping offers a way forward: by documenting spatial patterns explicitly, managers can make more informed decisions about where and how to apply inputs. Success of this technology, however, hinges on accurate assessment and quantification of the underlying soil variability.
Advances in global positioning systems and spatial analysis software have accelerated the integration of geostatistics into agricultural and environmental management. Geostatistics relies on spatial autocorrelation to generate a continuous surface from point data and to interpolate a variable at unsampled locations with an estimate of reliability. Among interpolation methods, kriging is a geostatistical analogue of least-squares regression that yields best linear unbiased predictions at unsampled locations.
Univariate methods such as ordinary kriging (OK) have been widely used to predict soil fertility profiles. When OK alone is insufficient, for example when sample size limits reliable estimates of spatial autocorrelation, combined approaches such as regression kriging (RK) and multivariate methods such as ordinary cokriging (OCK) become attractive. RK kriges residuals from a regression of the response on auxiliary variables; OCK assimilates secondary spatial information (often terrain attributes) into the prediction framework.
Problem Definition
Despite the growing toolkit of spatial interpolation methods (SIMs), it is not always clear which approach performs best for farm-scale soil fertility mapping, or when a simpler non-geostatistical model such as multiple linear regression (MLR) is enough. Strong spatial structure can violate independence assumptions in classical regression, while cokriging and regression kriging only improve predictions when secondary variables are informative.
This chapter asks: how do non-geostatistical and geostatistical approaches compare for estimating key soil fertility parameters, available nitrogen (AN), available phosphorus (AP), available potassium (AK), pH, cation exchange capacity (CEC), and organic matter (OM), and what does that imply for sampling intensity and precision nutrient management?
Our Approach
Study sites and soil data
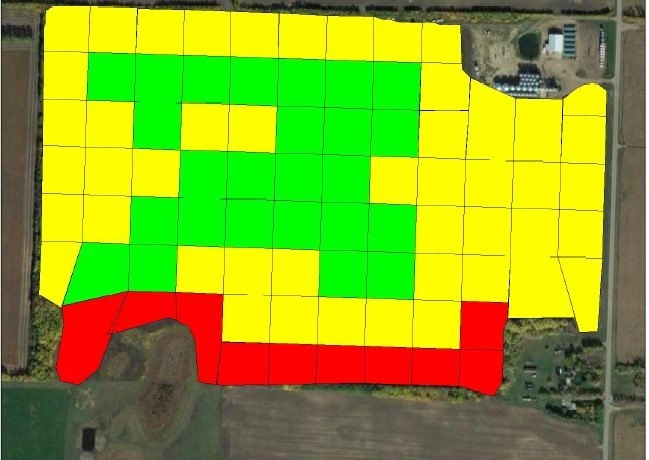
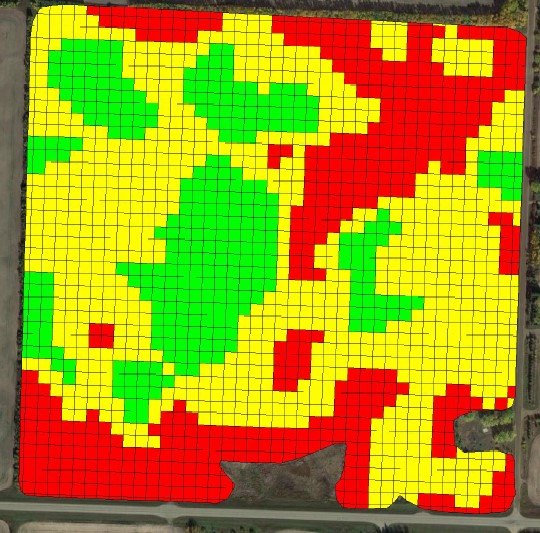
Analyses focused on commercial study sites near Edmonton, Alberta (including Bert and Lamoureux), managed under conventional tillage for arable cropping. Soil samples were collected on structured grids at 0–15 cm depth and analysed for AN, AP, AK, pH, CEC, and OM. Terrain covariates were derived from LIDAR-based digital elevation data to support multivariate and regression-based geostatistical models.
Statistical and geostatistical methods
The comparative framework included:
- Step-wise multiple linear regression (MLR) as a non-geostatistical baseline, with model selection guided by Akaike’s Information Criterion (AIC).
- Semi-variography to characterise spatial continuity of each fertility parameter (Gaussian, spherical, or exponential models fitted to experimental semivariograms).
- Ordinary kriging (OK), ordinary cokriging (OCK), and regression kriging (RK) as candidate SIMs.
- Leave-one-out cross-validation with RMSE, MSE, and MAE as primary performance metrics (R² was treated cautiously and not used as the sole model-selection criterion).
- Minimum sample size estimation based on spatial variability (sill-related CV) to quantify how many samples are needed for target accuracy levels.
All analyses were conducted in the broader quantitative framework of the Master’s research, linking spatial soil fertility structure to practical sampling and management decisions.
Results Overview
Descriptive statistics showed that available soil nutrients were often highly variable (CV frequently > 35%), while CEC and organic matter tended to show moderate variability. Step-wise MLR provided a useful starting point for correlations among variables, but it failed to capture underlying spatial structure. Where residuals remained spatially autocorrelated, classical regression assumptions were violated, limiting the practical usefulness of MLR even when fit statistics looked competitive.
Across the evaluated geostatistical methods, ordinary kriging generally performed best for soil nutrients (AN, AK, and AP), as indicated by lower cross-validation error statistics. Regression kriging outperformed OK and OCK for predicting pH, CEC, and OM at the study sites. Ordinary cokriging, despite assimilating additional terrain information, did not consistently improve accuracy, consistent with relatively weak correlations between soil fertility parameters and terrain covariates at these comparatively uniform sites.
Pearson correlations between grain productivity and terrain attributes were also weak, suggesting topography was not a dominant driver of soil fertility or yield response in this setting. Minimum sample size calculations further underscored a practical constraint: capturing spatial variability at useful accuracy thresholds can require substantial sampling intensity, with clear implications for the cost and logistics of precision mapping.
Conclusion
Although multiple linear regression offers an accessible entry point for exploring relationships among soil fertility variables, it is often insufficient once spatial autocorrelation is present. In this comparative assessment, ordinary kriging was typically the strongest performer for estimating soil nutrients, while regression kriging delivered more reliable predictions for pH, CEC, and organic matter. Landscape position and topography were not strong drivers of soil fertility or grain productivity at these sites, which helps explain why multivariate cokriging gained little from terrain covariates.
Taken together, the results reinforce a practical message for precision agriculture: method choice should follow the spatial structure of the target variable, and sampling designs must be powered for the variability that actually exists in the field. Getting those two pieces right is foundational to nitrogen stewardship, variable-rate application, and sustainable intensification.
Adapted from Chapter 3 of my Master’s thesis: Statistical and In-field Challenges Involved in Quantifying Crop Nitrogen Use Efficiency (NUE) and Spatial Soil Fertility in Central Alberta, University of Alberta, 2019. Read the full thesis →